PeakCNV
PeakCNV: A Multi feature ranking algorithm based tool for genome wide copy number variation association study
This project is maintained by mahdieh1
PeakCNV
A Multi-Feature Ranking Algorithm-based tool for Genome-wide Copy Number Variation-association study
PeakCNV is a tool for detection of genome-wide CNV-phenotype association study using machine learning techniques developed by BioMedical Machine Learning Lab(BML), and Data Analytics Lab. PeakCNV consists of three steps: (1) Building CNVRs; (2) Cluster CNVRs; (3) Selection. PeakCNV first computes the genome-wide probability of each base pair to be deleted or duplicated in case and control samples using the Fisher exact test resulting in identification of statistically significant CNVRs. Then, PeakCNV groups statistically significant CNVRs into different clusters based on two combined features. The first feature (importance) shows the number of samples in each region after removing the common samples between each two CNVRs. The second one is the distance between CNVRs. Finally, the best CNVR(s) from each cluster will be report as the representative of the cluster
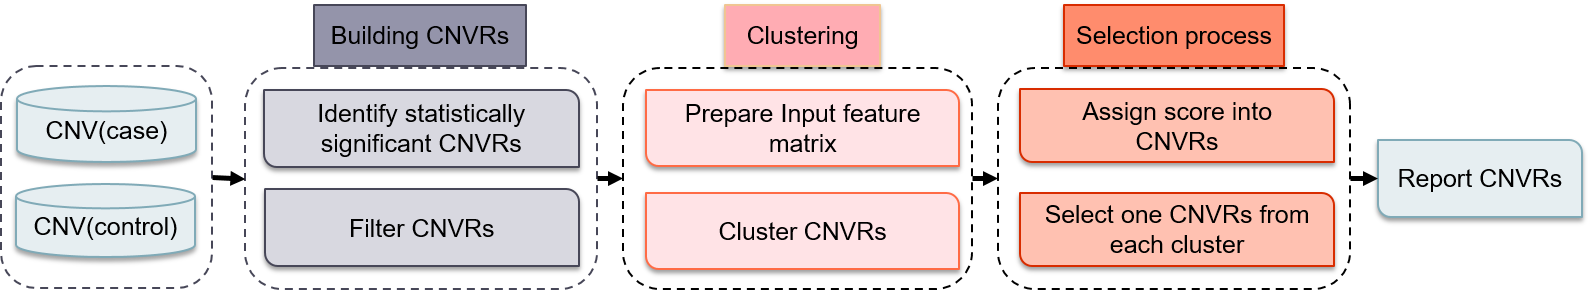
Table of Contents
- Installation
- PeakCNV analysis workflow
- Arguments
- Details of intermediate functions and file formats
- How to use
- Reference
- Author Info
- Acknowledgements
- License
Installation
PeakCNV runs on R (requires at least 3.2.0). Install the package from Github using the following R commands.
install.packages("devtools")
library(devtools)
install_github("mahdieh1/PeakCNV")
Alternatively, the package may downloaded from Github and installed in R:
# Clone/download PeakCNV into the current working dirctory with the following command: git clone https://github.com/mahdieh1/PeakCNV.git
PeakCNV analysis workflow
The full PeakCNV workflow includes the following 3 steps:
- Building CNVRs
- Clustering process
- Selection process
By default, the PeakCNV() function runs the entire workflow. However, it is possible to run specific steps of the workflow by specifiying the run.to parameter (see full documentation).
Arguments
| Parameter | Type | Description | Default |
|---|---|---|---|
| run.to | Numeric | Steps to run | 1,2,3 |
| working.dir | String | Working directory | current working directory |
Details of intermediate functions and file formats
| Step | run.to |
|---|---|
| 1 | 1 |
| 2 | 2 |
| 3 | 3 |
Step 1 - Building CNVRs
PeakCNV builds deletion and duplication CNVR maps for cases and controls by merging genomic coordinates of deletion and duplication type of CNVs, respectively. Then, PeakCNV estimates the probability of being either deleted or duplicated in cases versus controls for each base pair of these maps using one-tailed Fisher’s exact test. The output of this step is CNVRs that are significantly more frequently duplicated or deleted in cases or controls individuals.
PeakCNV(1)
Output generated in Step 1:
| Filename | Description | Required fields |
|---|---|---|
| step1 | list of positions that probability of being either deleted or duplicated in cases versus controls | Chromosome, Start position, End position |
Step 2 - Clustering
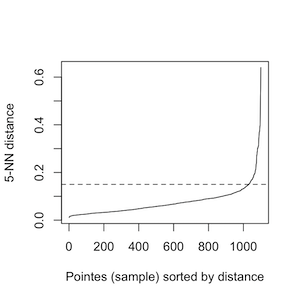
To identify those CNVRs in the proximity of each other with the similar percentage of case samples coverage, PeakCNV performs clustering step. In this step, for each chromosome, PeakCNV asks you the eps value based on the k nearest neighbors(knn) plot. The optimal value is an elbow, where a sharp change in the distance occurs. For example, in the below image, the optimal eps value is around a distance of 0.15.
PeakCNV(2)
Output generated in Step 2:
| Filename | Description | Required fields |
|---|---|---|
| Clustering | list of CNVRs with their cluster number | Chromosome, Start position, End position, sample number, cluster number |
Step 3 - Selection
PeakCNV selects the most independent CNVRs fro each cluster.
PeakCNV(3)
Output generated in Step 3:
| Filename | Description | Required fields |
|---|---|---|
| FinalCNVRs | list of selected CNVRs | Score, Chromosome, Start position, End position, sample number, cluster number |
How to use
By default, PeakCNV runs in the current working directory unless specified by the user. By default, results will be saved in the working directory. In clustering step, for each chromosome, PeakCNV asks you the eps value based on the k nearest neighbors(knn) plot. The optimal value is an elbow, where a sharp change in the distance occurs.
library("PeakCNV")
PeakCNV()
Download the test data sets from https://github.com/mahdieh1/PeakCNV/tree/main/test-data into your working directory.
Input files
- Case CNVs (case.bed):
| Chr | Start | End | Sample-Id |
|---|---|---|---|
| 1 | 6742281 | 6742903 | SP7890 |
- Control CNVs (control.bed):
| Chr | Start | End | Sample-Id |
|---|---|---|---|
| 1 | 6742281 | 6742903 | sa321 |
Please put input files (case.bed and control.bed) in the working directory. If your CNV list contains chr X or Y, please replace them with 23,24.
Output files:
- CNVRs (Step1.bed):
| Chr | Start | End |
|---|---|---|
| 1 | 6742281 | 6742903 |
- clustered CNVRs (clustering.txt):
| Chr | Start | End | #case | Cluster-NO |
|---|---|---|---|---|
| 1 | 6742281 | 6742903 | 15 | 7 |
- Selected CNVRs (selection.txt):
| Score | #chr | Start | End | #case | Cluster-NO |
|---|---|---|---|---|---|
| 56 | 21 | 6742281 | 6742903 | 15 | 7 |
Reference
Please consider citing the follow paper when you use this code.
  Title={},
  Authors={}
}
Contacts
I will be pleased to address any question or concern about the PeakCNV package: In case of queries, please email: mahdieh.labani@students.mq.edu.au
People who contributed to the PeakCNV idea and code:
- Mahdieh Labani
- Ali Afrasiabi
- Amin Beheshti
- Hamid Alinejad-Rokny
License
This package is free software; you can redistribute it and/or modify it under the terms of the GNU General Public License, version 3, as published by the Free Software Foundation.
A copy of the GNU General Public License, version 3, is available at https://www.r-project.org/Licenses/GPL-3
Acknowledgements
This work was funded by the UNSW Scientia Program Fellowship and the Australian Research Council Discovery Early Career Researcher Award (DECRA), Macquarie PhD Scholarship and Australian Government Research Training Program (RTP) scholarship. Analyses were made possible with High Performance Computing resources provided by the BioMedical Machine Learning Lab with funding from the Australian Government and the UNSW SYDNEY.